|
MACHINE LEARNING: VISUALIZATION + INTERPRETATION

|
 |
|
Tools for Model Understanding (2016-2018)
Google Big Picture team
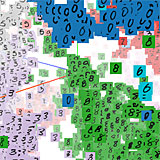
A theme for the Big Picture research group has been the creation of tools
for exploration and interpretation of machine learning systems. Examples: Facets,
a visualization of training data; SmoothGrad, a library for interpreting image classification networks;
and Attacking discrimination with smarter machine learning, a
simple simulation of issues in fairness in ML.
|
|
 |
|
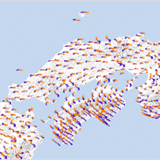
Earth Science, ML, and visualization (2016-2018)
With Brendan Meade, Phoebe DeVries, Fernanda Viégas; Jimbo Wilson
Earth scientist Brendan Meade spent time as a visiting professor in our research group
at Google, investigating how machine learning and
visualization can provide scientific insight. Our 2018 Nature paper,
Deep learning of aftershock patterns following large earthquakes,
introduced a state-of-the-art model for predicting aftershock locations.
Other results include a visualization of geodetic velocities and a
statistical analysis of earlier methods of predicting earthquake aftershocks.
|
|
 |
|
TensorFlow.js (2017-2018)
A Google Brain project
My team at Google initiated the Javascript version of TensorFlow (Google's flagship machine learning platform).
The goal is to broaden the community of people working with state-of-the-art ML tools. A paper on the system is in progress.
See code and documentation.
|
|
 |
|
Testing with Concept Activation Vectors (TCAV) (2018)
With Been Kim, Justin Gilmer, Carrie Cai, James Wexler, Fernanda Viegas, Rory Sayres
A technique for investigating neural networks in terms of user-defined high-level concepts, rather than low-level features.
See ICML 2018 paper and open-source implementation.
|
|
 |
|
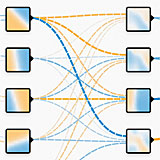
Visualizing translation (2016)
With multiple Google teams
My team worked with colleagues in Google Brain and Google Translate
to understand the mechanisms learned by a "many-to-many" translation
deep network. Our visualizations are described in
this TACL paper
and suggest the network may be learning a language-independent representation
of meaning.
|
|
 |
|
Embedding Projector (2016)
A Google Big Picture project
The Embedding Projector is a rich, interactive environment for visualizing
the kind of high-dimensional data often found in machine learning systems.
It is integrated into the TensorFlow platform.
See the live version or
read our NIPS 2016 workshop paper.
|
|
 |
|
TensorFlow Playground (2016)
A Google Big Picture project
The fast-growing interesting in neural networks has lead to an equally fast-growing
demand for educational material. The TensorFlow playground is a
direct-manipulation educational tool that lets users work with neural nets
without any programming. Try it now!
The system was described in
this ICML 2016 workshop paper.
|
|
 |
|
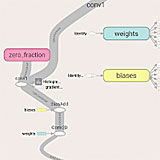
TensorFlow Graph Visualizer (2015)
A Google Big Picture project
A visualization of the complex data flow graphs used in the TensorFlow
platform. The tool introduces new graph layout techniques (including
strategically rewriting the graph where necessary) to allow for a clear,
readable display.
See TensorFlow
documentation or
read the TensorFlow whitepaper.
|
|
 |
|
GridViz (2013)
With D. Sculley
This visualization was created for comparing models used in
a large-scale, mission-critical machine learning system inside of Google.
The goal was to give engineers a visual "diff" between
multiple possible changes.
The system was described in
this KDD 2013 paper.
|
|
SOCIAL AND COLLABORATIVE VISUALIZATION
|
 |
|
Google+ Ripples (2011-2015)
With Big Picture and Social teams at Google
Ripples was a live visualization of sharing on Google+. Using
a novel algorithm based on a circular treemap concept, this feature
provided a data-dense view of social behavior.
See our WWW 2013 paper.
|
|
 |
|
Many Eyes (2007-2015)
With F. Viégas, J. Kriss, F. van Ham, and M. McKeon
Many Eyes is a free site where anyone can upload, visualize, and discuss data.
It is a long-term experiment created by the Visual Communication Lab.
Read more.
|
|
 |
|
sense.us (2006)
With Jeff Heer and Fernanda Viégas
A web project allowing social, visual exploration of U.S. Census
data. The site supports view sharing,
discussion, sophisticated graphical annotation and social navigation. Sense.us was an
IBM internal site (Jeff's project as an intern in my lab), but you can
watch a video demo.
Read more on the sense.us project page
at Berkeley.
|
|
 |
|
Baby Names and Social Data Analysis (2005)
With Laura Wattenberg
An online visualization of baby name trends over the past century. This
applet was originally created to celebrate the publication of my wife's
book on baby names. Its surprising popularity, and the social kind of data
analysis it spurred on blogs and online forums, helped change the
direction of my visualization research.
More Info.
|
|
ONLINE COLLECTIVE INTELLIGENCE
|
 |
|
History Flow & Wikipedia studies (2003-6)
With Fernanda Viégas
In 2003, Fernanda and I decided to investigate the dynamics behind editing
in Wikipedia. History flow is the method we invented to make sense of the
data we collected. We went on to study other aspects of Wikipedia,
including the emergence of a new form of bureaucracy.
More Info.
|
|
 |
|
Chromogram (2006)
With Fernanda Viégas and Kate Hollenbach
How do you visualize a list of tens of thousands of words? A "chromogram"
translates those words into colors, using a straightforward alphabet-based
code, and plots them on a timeline. Although the method seems almost too
simple to work, it was effective in uncovering some surprising patterns in
Wikipedia editing histories.
HINT.FM chromogram project page.
|
|
 |
|
ForumReader (2003)
With Kushal Dave, David Millen, and Michael Muller
A visual conversation browser. ForumReader presents a graphical
overview of a large conversation to let users scan and access hundreds
of messages rapidly.
Flash Forums and ForumReader: Navigating a New Kind of Online Discussion, Kushal Dave, Martin Wattenberg, and Michael Muller. CSCW 2004.
|
|
GENERAL VISUALIZATION TECHNIQUES
|
 |
|
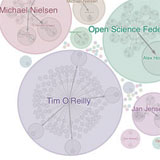
Phrase Net (2009)
With Fernanda Viégas and Frank van Ham
A phrase net is a "language network" visualization of word co-occurrence
data. It can provide a simple and easy-to-interpret view of relationships
in a text.
Read our
InfoVis 2009 paper.
|
|
 |
|
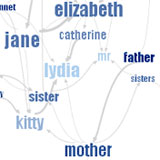
Word Tree (2007)
With Fernanda Viégas
A word tree is a visual search tool for unstructured text,
such as a book, article, speech or poem. A graphic version of
the traditional concordance or keyword-in-context seach, it lets you pick a
word or phrase and shows you all the different contexts in which it appears.
The contexts are arranged in a tree-like branching structure to reveal
recurrent themes and phrases.
Paper:
The Word Tree, An Interactive Visual Concordance Martin Wattenberg & Fernanda Viégas, InfoVis 2008.
|
|
 |
|
Comet Charts (2014)
With Zan Armstrong
Simpson's Paradox is a notoriously confusing effect in which
aggregate numbers seem to contradict more detailed statistics.
A "comet chart" is a special type of scatterplot which help analysts
detect and understand this type of situation.
Read our
InfoVis 2014 paper.
|
|
 |
|
Stream Graph Algorithms (2008)
With Lee Byron
A stream graph is a time series visualization technique invented
by Lee Byron, who used it
to great effect to display listening histories
and movie box office sales.
With Lee I coauthored a paper on the technique; my primary contribution
was a very simple mathematical framework that unifies known stacked graph algorithms
in terms of the balance they strike between various aesthetic criteria.
Paper:
Stacked Graphs - Geometry & Aesthetics, Lee Byron & Martin Wattenberg, InfoVis 2008.
|
|
 |
|
PivotGraph (2005)
A new technique for visualizing and analyzing complex graph structures, such as social networks.
The method is designed for graphs that are �multivariate,� i.e., where each node is associated with several attributes.
Unlike visualizations which
emphasize global graph topology, PivotGraph uses a simple grid-based approach to focus on the relationship between
node attributes & connections.
Visual Exploration of Multivariate Graphs,
Martin Wattenberg, CHI 2006.
|
|
 |
|
Jigsaw Maps (2005)
The quest for a "perfect" treemap algorithm led me to create this variant,
a jigsaw map. I proved that this layout, based on the geometry of
space-filling curves, is optimal in a certain mathematical sense. In 2006
this layout was independently invented and popularized in the wonderful
comic XKCD to map the internet.
A Note on Space-Filling Visualizations and Space-Filling Curves, IEEE InfoVis 2005.
|
|
 |
|
Arc Diagrams (2001)
A method for visualizing repetitive structure in sequences. I used this technique in the Shape of Song. Read more about the research and associated artwork
Paper:
Arc Diagrams: Visualizing Structure in Strings. IEEE InfoVis 2002.
|
|
 |
|
QuerySketch (2001)
A technique to query a time-series database, such as historical stock
market performance data, by sketching a target graph. This simple,
intuitive interface allows instant composition of complex queries (e.g.
performance opposite to a current portfolio for diversification; response
to a historical event). Online demo
| short
paper: CHI 2001 (pdf)
|
|
 |
|
Map of the Market (1998-2014)
A visualization that allows users to see performance of hundreds of stocks
at once, with a rich context of industry and value information. A new
algorithm lets an existing visualization technique, the treemap, scale
more effectively. The resulting transparent view of the market has been
widely adopted by financial institutions and investors.
More Info |
short
paper: CHI 1999 (pdf)
|
|
THEORY AND ALGORITHMS
|
 |
|
Perceptual Organization in
Information Graphics (2003)
With Danyel Fisher
A conceptual model and prototype program to analyze levels of
perceptual structure in graphics, based on scale-space theory.
IEEE InfoVis 2003, Information Visualization 2004 (pdf)
|
|
 |
|
Treemap Algorithms (2001)
with Ben Bederson, Ben Shneiderman
Techniques to control aspect ratios in treemap displays, while preserving
order and stability in the presentation of dynamic data.
Online demo
Papers: ACM
Transactions on Graphics 2002 (pdf), IEEE
InfoVis 2001 (pdf)
|
|